Kevin’s Summer Project
2012-11-05Cavs fans, bear with me here. This summer, my NBA draft-experting led me down a rabbit-hole I could not evade. As the draft approaches, a plethora of athleticism data arrives in late May and early June, and I struggle with the question: “what does it mean”? Dion Waiters is only 6’ – 4”; Jeremy Lamb has long arms; in a laboratory, Harrison Barnes jumps really high. Should I care about any of this? I embarked on a project to track how pre-draft measurements correlate to actual, eventual NBA production. In today’s post, I hope to introduce the process.
I started by compiling the pre-draft measurements for every drafted NCAA player from the 2000 through 2010 drafts. This data was gleaned from the world’s most comprehensive draft website: drafexpress.com. I focused on eight measurements:
- Barefoot Height
- Wingspan
- Reach
- No-Step Vertical Leap
- Maximum Vertical Leap
- Three-Quarter Court Sprint Speed
- Lane Agility (Cone) Drill
- Bench Press reps of 185 pounds.
To my spreadsheet, I assembled every player’s Offensive Win Shares (OWS), from basketball-reference.com, for each of their first four seasons. For players drafted in 2000 through 2007, their “peak” season of OWS from their first four years is also evaluated. The analysis ignores the strike-shortened 2011 – 2012 season, hence no four-year-peak season for 2008 draftees. I purposefully chose separate offensive and defensive metrics.
Also, players were sorted into two groups by age; 21 and under as of February 1st of their rookie year, or Older. Additionally, players were categorized by the five standard basketball positions. Utilizing the positional-labels proves important, as comparing OWS across the entire spectrum of possible heights and athleticism would be meaningless; obviously both tall and short players are successful; clearly little guys are faster than big men, but both succeed.
After sorting into those various categories, I correlated each of the eight measurements with the players’ OWS’s. Each player had a maximum of five OWS values: 1st season, 2nd season, 3rd season, 4th season, and peak. Near-zero correlation meant no discernible relationship between the measurement and NBA offensive performance. Highly positive correlations reflect that players strong in that particular measurement were likely to be successful offensive players. Negative correlations can largely be regarded as near-zero; I won’t advance any theories that a certain group of players is better off being smaller or less athletic. (As a final note, speed and agility correlations were made negative; i.e. smaller sprint times resulting in larger OWS are reflected as positive correlation.)
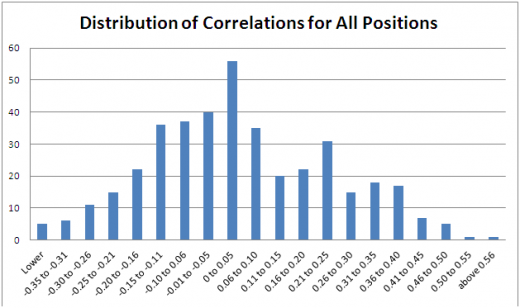
With that as the basics of the study; the pre-draft measurements provide a fairly minimal array of predictive uses for offensive production. For five positions, two age groups per position, five seasonal OWS values, and eight measurements; there were four-hundred correlations. The graph below reflects their distribution.
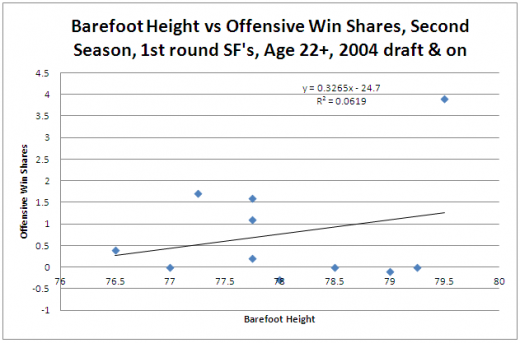
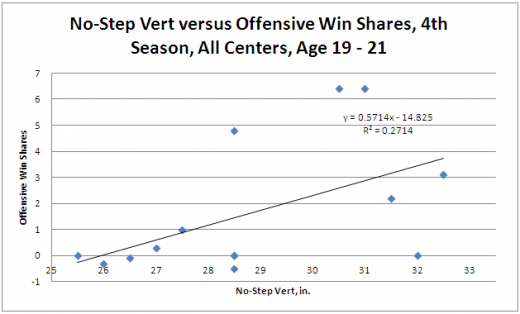
As you can see, this is approximately a bell-curve centered near zero. Of the 400; only 228 (57%) are positive correlations, only sixty-five (16.3%) exceed 0.25, and only two exceeded 0.50. As a frame-of-reference, here are graphs reflecting 0.25 and 0.50 correlations:
The 0.25 correlation graph is fairly useless. In the specific case of this graph, Danny Granger was both tallest and overwhelmingly most offensively successful. This alone drove the positive correlation. The next four-tallest players were all offensively worthless.
The 0.5 correlation starts to resemble something meaningful. Four of the five highest-leapers managed successful seasons, and the fifth was Greg Oden. With one exception, the low-fliers all struggled.
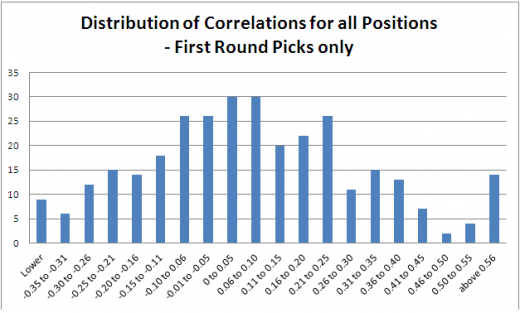
Part of the draw towards the low correlations is second-round picks adding noise to the data, as every NBA flame-out was awarded zero win-shares for each season. Looking only at first-round picks, with their guaranteed contracts, provides the distribution below. There are only 320 correlations here, due to sample-size issues. For both guard positions, there were relatively few upperclassmen first round picks, so I left everyone in one age-group.
194 (60.6%) were positive, with sixty-six (20.6%) exceeding 0.25. Most encouragingly, a tantalizing eighteen rose above 0.50.
Well, hopefully I have capably communicated the basics. The only conclusion I hope you drew today is that the pre-draft size and athleticism measurements offer little predictive information relating to NBA offensive performance. Over the course of the season, I plan on providing insights into:
- What are those high-correlation measurements? How useful are they?
- What about defense? A reasonable hypothesis would say that size & athleticism are more critical there.
- Which measurements rarely or never provide strong correlation with offensive or defensive performance and hence, are reasonable to ignore?
- Are there athletic traits that NBA teams are over or under-valuing? Certainly some negative correlations are due to GM’s overpersuing players based on certain athletic profiles that do not reliably prove successful.
- Are there combinations of traits that prove highly reliable towards predicting success of a drafted player? What about failure?
- Did the hand-check rules initiated in 2004 – 2005 make speed & athleticism more important?
I hope this turns out to be an interesting and provocative series. Let me know your thoughts in the comments section.


This is a really cool idea, you always wonder with all the media focus on combines and workouts how well they actually translate to real performance. Have you tried any regressions at all, using the athletics measurements as actual predictors of win shares? That may be a way to address some of the issues with the traits not being completely independent of each other. I’ll be looking forward to this series, I have lots of experience with stats and love seeing them used in basketball. Good work!
Kevin, ya better put on those wine-colored glasses! Dion is going off! Haha!
Well Nate – I baited myself into compiling some stats. This link is a spreadsheet containing some stats from the top 10 point guards in 2011-2012 and 1991-1992. https://docs.google.com/open?id=0Bxo35h7IHewyT20tVE9NeTFsNXM Unfortunately, it is difficult to compare shot selection. My hypothesis would be that today’s PGs take and make a higher % of shots from the painted area than PGs from 20 years ago. (and that the ratio of off the dribble 3s to spot up 3s is higher) However, this is very difficult to prove with stats. I tried using Free Throw Attempts per FGA as an indicator since I would… Read more »
Nate – yeah definitely the best PGs from 20 years ago would be just fine with todays rules. The difference is, someone like John Wall may have not even been drafted in the 1st round 20 years ago. The idea that what you wanted most out of your point guard was an explosive first step and an ability to finish at the rim was icing on the cake, not the meat and potatoes. KJ was a great example of a PG that could get to the rim and finish and draw fouls. But KJ also shot extremely well from the… Read more »
Interesting take on the game, Tsunami. Have you been a blown away as I have early in the season by the assist totals that big men are racking up? I’ve seen some big games. It seems that Big men like the Gasol Brothers, Diaw, Noah, AV are bumping up assists more than before. I attribute it to these dribble handoff and princeton offense where big man hit cutting wings or do pivot screens. Point guards have really become distributors and finishers much more than before. However, there are plenty of “old school” point guards that could play today: KJ, Mark… Read more »
Interestingly, it seems like if you add in some performance stats (points, rebounds, etc.) you’ll get something close to what Hollinger’s done with his draft rater. Except you’re doing it for free, and making your methods publicly available. Yay!
As Nate said, you have to account for the fact that these traits aren’t entirely independent, which unfortunately makes the analysis much more difficult. That means that if you want to check, say, how important the sprint is for a point guard, you ideally want a set of point guards who are very similar in all other measurements, but very different in sprint times, which is probably (unfortunately) a very small dataset. For instance, say that sprint time and height are both advantages for point guards, but sprint time is much more of an advantage. Because taller PG’s generally have… Read more »
Cool! Looks like you are angling for a job with a front office! For some time people have shown that “athletic” stats like rebounding/steals/blocks seem to imply an NBA-capable level of athleticism. Basically, that the game won’t be too fast at the next level if you are in the upper echelon of those stats at the college level. Of course, that doesn’t mean you can actually play, but the idea is that those are the things that won’t even change or get better – where you can develop techniques. I’m not sure that line of thinking is totally true. Clearly,… Read more »
Tsunami,
If I am angling for a front office job; I am doing it wrong.
Awesome idea. I’d add another measurement to the database: hand size. I also think that bench press stats may have to be correlated to wingspan: it is easier for a guy with short arms to bench press.
Nate Smith,
Hand-size has only started being tracked in the last few years. There isn’t enough data available to decide anything meaningful.
One number I ignored that may be relevant is “reach + vert”.