Kevin’s Pseudo-Scientific 2013 – 2014 Projections!!
2013-08-18We slowly wake and stretch, yawning loud enough to shake earth. We’re hungry, and a little cranky; Colin may be a lot cranky. That is what arising from hibernation looks like though. Unlike most mammals that enjoy long naps however, the Cavs:the Bloggers doze off in the summer. But as this sunny season rolls towards September, our old routines resume.
For me, that involves tenuously linking numbers, hoping to fall on the right side of the line separating projecting from making things up. Over a series of articles, various advanced stats will be utilized to forecast “unbiased”, “good case”, and “bad case” scenarios for the 2013 – 2014 Cavs. For this team, a large, very realistic spread exists between those latter two. Today, a projection forms utilizing Win Shares data from basketball-reference.com and this associated aging curve. The “unbiased” outlook is presented in this article, with only the team’s minutes distribution subjectively assigned by me. And generally, I used history as a guide there, too. Aside from that, the projection is built from:
- Each player’s 2012 – 2013 Win Shares per 48 minutes (WS/48)
- An appropriate increase or decrease for each player based on their positional aging curve.
- Andrew Bynum was assigned 0.15 WS/48. This is a decrease from performance over his last four seasons (0.183, 0.21, 0.188, 0.184). After a year off, and battling balky knees, this seems appropriate.
- Anthony Bennett’s rookie season WS/48 is set equal to the average of the rookie seasons of the prospects that I considered him most close in June.
- Sergey Karasev and Carrick Felix receive forecasted WS/48 equivalent to the average of all 2012 – 2013 rookies.
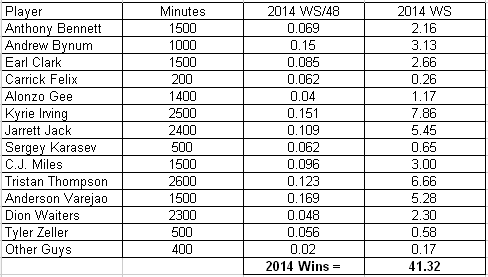
A summary table of results looks like (0.1 WS/48 is league average):
And what do you know? A 41 – 41 record…8th seed, here Cleveland comes. But where do the wins come from?
- Kyrie plays around 70 games and continues his trend towards superstardom. The WS/48 is very nice for a 21-year old point guard, but not quite his possible peak. Let’s delve into that Friday.
- Tristan leads the team in minutes, building on last year’s improvements, and pitches in almost seven win shares.
- Jarrett Jack provides reliable, durable substitute combo-guarding to start earning his $24 million contract. This trio accounts for half the victories.
- Buoyed by reduced nightly minutes to 25, Andy offers 60 games of high impact basketball.
- Call it fifty 20 minute games, or thirty 33 minute games, but Andrew Bynum suits up for one-fourth of the minutes at center; just enough to push the Wine & Gold into the postseason.
- C.J. Miles and Earl Clark replicate their age 25 seasons, providing decent punch as wingmen to Irving, Jack and Waiters.
- Speaking of Dion, this result would be a disappointment; I expect him to exceed 2.3 win shares. But this is the “unbiased” version, so a couple of non-imparted thoughts here. First, Dion’s 2013 play greatly bettered his 2012 output. The switch appeared to flip for him after the New Year, but the number in the table also includes his amazingly inefficient November and December. Second, the Cavs defense stunk last year, of course due in part to Dion; he tallied only 0.6 defensive win shares*. Thanks to Mike Brown and hard-earned lessons learned, the general expectation is that the Cavaliers improve significantly at this end in the upcoming season.
- Anthony Bennett performs acceptably, but not outstanding.
That is the “unbiased” look via Win Shares; I took last season’s WS/48, applied aging, and calculated team wins. The answer = exactly a five-hundred record. Nothing looks outlandish about the minutes distribution or results, but over the next couple weeks, come back, as I evaluate the impact on the projection from the inputs appearing most prone to go better or worse.
* I really like Offensive Win Shares. In fact, I built half of a 15-part series using it. Defensive Win Shares and defensive rating are too team contingent though. Basically if a guy plays many minutes on a good defensive team, his D rates as serviceable, even if individually he stinks. Everyone logging minutes on a horrid team earns lackluster marks, even if individually they’re pretty solid. Here’s a quick example:
- Tristan Thompson played 2564 minutes last year. He was a reasonably stout defender on an abysmal defensive team. He garnered 2.0 defensive win shares (DWS).
- The Bulls are an excellent defensive team. Nate Robinson though, not necessarily. Marco Belinelli, him neither. The former earned 2.4 DWS in 2086 minutes, while the latter compiled 1.6 in 1882 minutes.
So, 5′ 9″ Nate Robinson was a better defender than Tristan Thompson last season, both for quality and quantity…at least his Italian teammate was only better for quality.
What’s the point? I don’t really have one, other than I like flagging flaws in my work. Forecasting future performance utilizing an imprecise (or not even good) defensive measure certainly imparts some inaccuracy into the results. After my “good” and “bad” cases for Win Shares, I’ll see what RAPM has to say about the 2013-2014 Cavaliers.


I like it. I think if we can stay healthy they could be fighting for the 4/5 seed with the Knicks, Nets, Bulls. Here’s to hopes and dreams.
Nice write-up, Kevin. It’s pretty clear from this that the biggest dearth of talent is at small forward. The wing spots, in general, are pretty rough. I fully expect to see Jack and KI on the floor together a lot in crunch time this year, for that reason — possibly with Dion, who absolutely has to get his Wins Shares up. They’re wretched. My biggest fear about this team is that they have a lot of guys who are good at offense, or good at defense, and not a lot of guys who are good at both, especially when it… Read more »
“transparent assumptions that can be openly debated”
@grover13 Awesome choice of words.
Very well put together analysis, with transparent assumptions that can be openly debated. I think 41-41 is a good starting point, and we can deviate from that on the high side and low side as we tear apart the likelihoods of the assumptions used (growth curves, regressions, injuries, chemistry, etc).
My kinda thinking.
40ish wins seems about right. However, I can easily see this being off by +/- 10 wins. Every position is now upgraded with either new personel and/or young players who should just ‘naturally’ be better than last year. Bynum, if healthy should be a real difference maker as he’ll be motivated with 3/4 of his contract on the line. I think the fact that we also have decent depth at every positon – even SF, will also be a huge boost for us. IF either Bennette or Karasev can come in and play better than an average rookie, then I… Read more »
The Nupe,
I don’t know…my extremely infallible calculations say it will take just 70 games of Kyrie, 60 games of Andy (25 minutes each), and 40 games of Bynum (25 minutes each), and the team can win 41 games. Jarrett Jack and Tristan play 80+ though.
I really liked this analysis… And ended up where I would think the Cavs would end up this year – 40 wins give or take 5-10. However, this is assuming we do not get bitten by the injury bug like we have the past few years. So, if everyone is healthy 100%, maybe 45 wins? Let’s hope we see some progression by the team this year…
I think that this is a very reasonable assumption here. I think that the Cavs can get anywhere from 30-50 wins this year, though the further you get from 41, the less likely (exponentially so) that this is going to get.
Wouldnt Dion earn more minutes than Jarrett Jck?
Vb,
Jack rarely misses a game; I gave him credit for playing 80+ games. I assumed Dion would miss 7 – 10. Per game, I think Dion plays slightly more.